
Observability is the ability to measure a system’s current state or health based on its outputs, such as:
- 1. Logs: Records of events, errors, and system activities.
- 2. Metrics: Numeric measurements used to quantify the performance and health of services.
- 3. Traces: Track how services connect from end to end in response to requests.
These are the three pillars of observability. The pillars work together to provide deep insights into the health, performance, and behavior of a system or infrastructure. Thereby helping teams monitor, debug, and optimize their applications.
OpenTelemetry is an open-source framework that collects and exports telemetry data by instrumenting application code to generate additional details as events occur.
Atoti Python API features an observability plugin that uses OpenTelemetry to collect and export telemetry data as events are triggered in Atoti. For this walkthrough, we’ve set up a collection of Docker containers and underlying services to handle our resulting Atoti telemetry data by visualizing them in Grafana.
💡For this walk through, check out the Observability with OpenTelemetry notebook to follow along!
The OTEL stack
To set up observability for Atoti using OpenTelemetry, we first need a place to send our metrics, logs, and traces. To accomplish this, we’ll use the following multi-container Docker application:
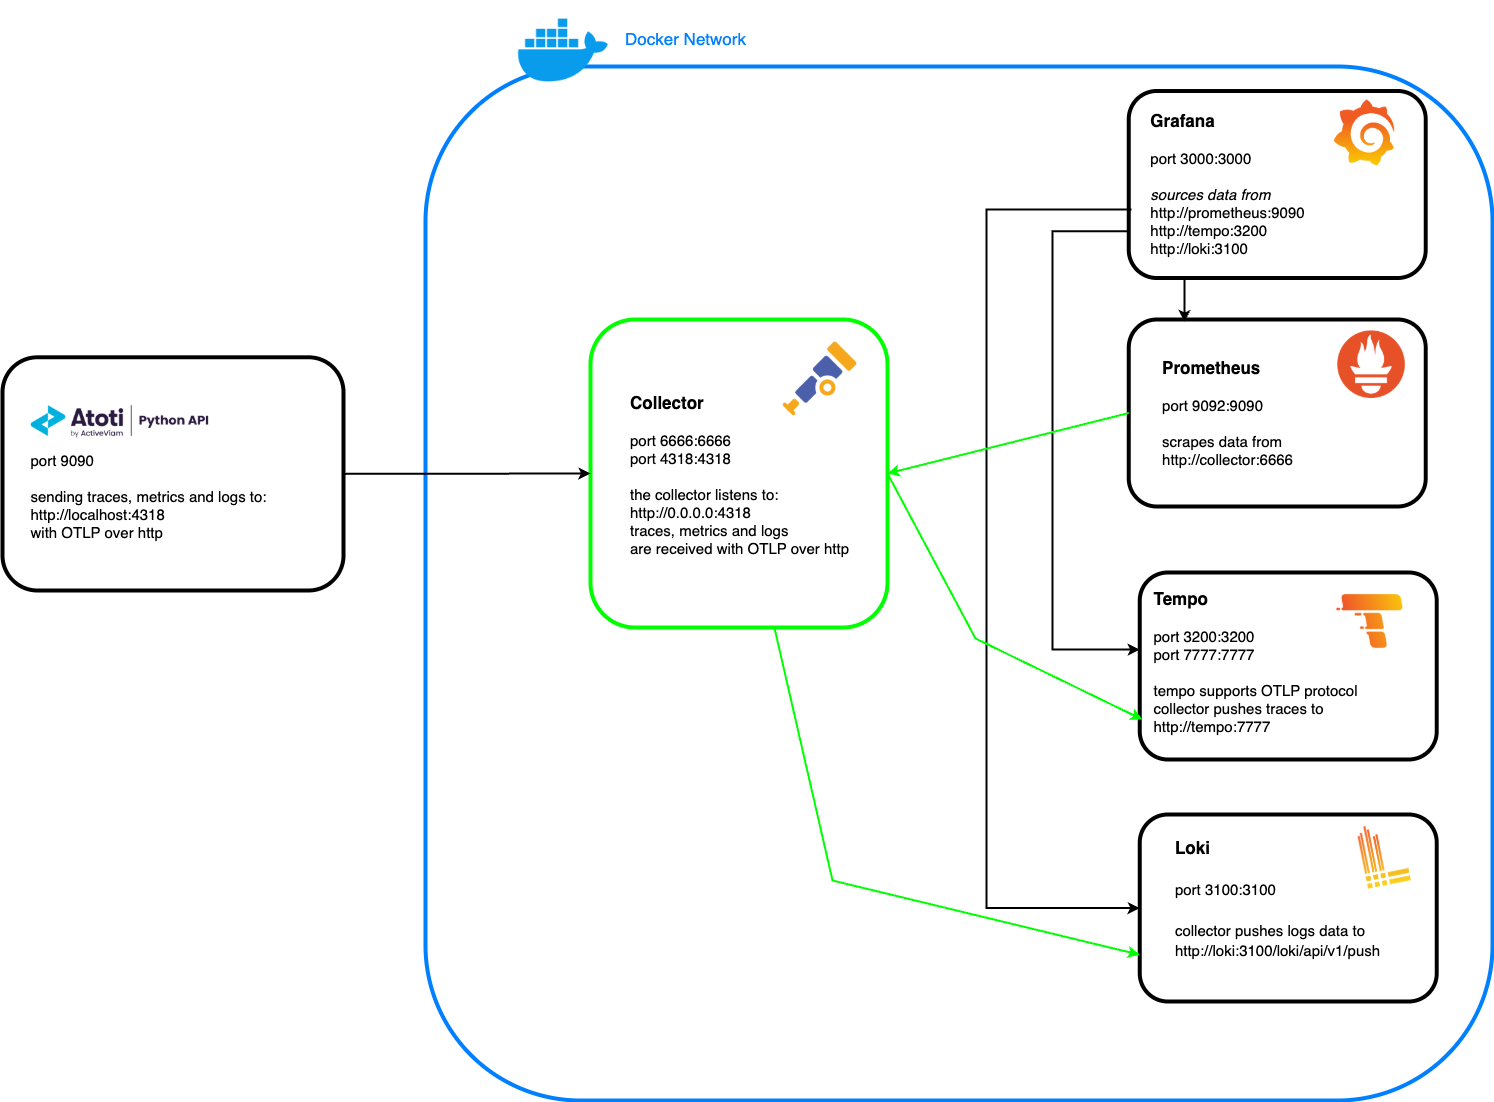
With the Atoti Python API observability plugin, Atoti can use OpenTelemetry to instrument its code and generate telemetry data during execution. This is then handled by the OTEL collector and sent to the corresponding services integrated with Grafana:
- Traces: Exported to Tempo (with OTLP).
- Logs: Exported to Loki (push to an endpoint).
- Metrics: Scraped from the OTEL collector endpoint via Prometheus every 15 seconds.
Installation
We need to first download and install the observability plugin via uv:
uv add 'atoti[observability]'==0.9.2
uv run jupyter-lab
Next, we need to start the OpenTelemetry stack using its associated docker-compose.yml file. The containers and underlying services handle the traces, metrics, and logs data generated from Atoti.
$ docker compose up -d
...
[+] Running 6/6
 ✔ Network otel-net                   Created                              0.0s
 ✔ Container otel-stack-loki-1        Healthy                              0.0s
 ✔ Container otel-stack-prometheus-1  Healthy                              0.0s
 ✔ Container otel-stack-tempo-1       Healthy                              0.0s
 ✔ Container otel-stack-grafana-1     Started                              0.0s
✔ Container otel-stack-collector-1 Started 0.0s💡Note: Verify the Docker containers are properly set up by using docker ps. If issues arise when starting the OTEL stack, check the logs within each Docker container using the docker logs command.
Getting started
When configuring the session in Atoti Python API, we need to add additional JVM arguments to the underlying server. These configurations instruct Atoti to use OpenTelemetry and send the various traces, logs, and metrics to the OpenTelemetry collector. The OTEL collector then processes the data and makes it available to the respective services in Grafana.
session = tt.Session.start(
tt.SessionConfig(
port=9105,
java_options=[
"-Dspring.profiles.active=application-monitoring",
"-Dotel.java.global-autoconfigure.enabled=true",
"-Dotel.traces.exporter=otlp",
"-Dotel.metrics.exporter=otlp",
"-Dotel.logs.exporter=otlp",
"-Dotel.exporter.otlp.endpoint=http://localhost:4318",
"-Dotel.resource.attributes=service.name=atoti,service.version=1.0",
"-Dotel.exporter.otlp.protocol=grpc",
"-Djson.log.dir=logs",
"-Dotel.traces.sampler=always_on",
"-Dotel.metric.export.interval=1000",
"-javaagent:opentelemetry-javaagent.jar",
],
)
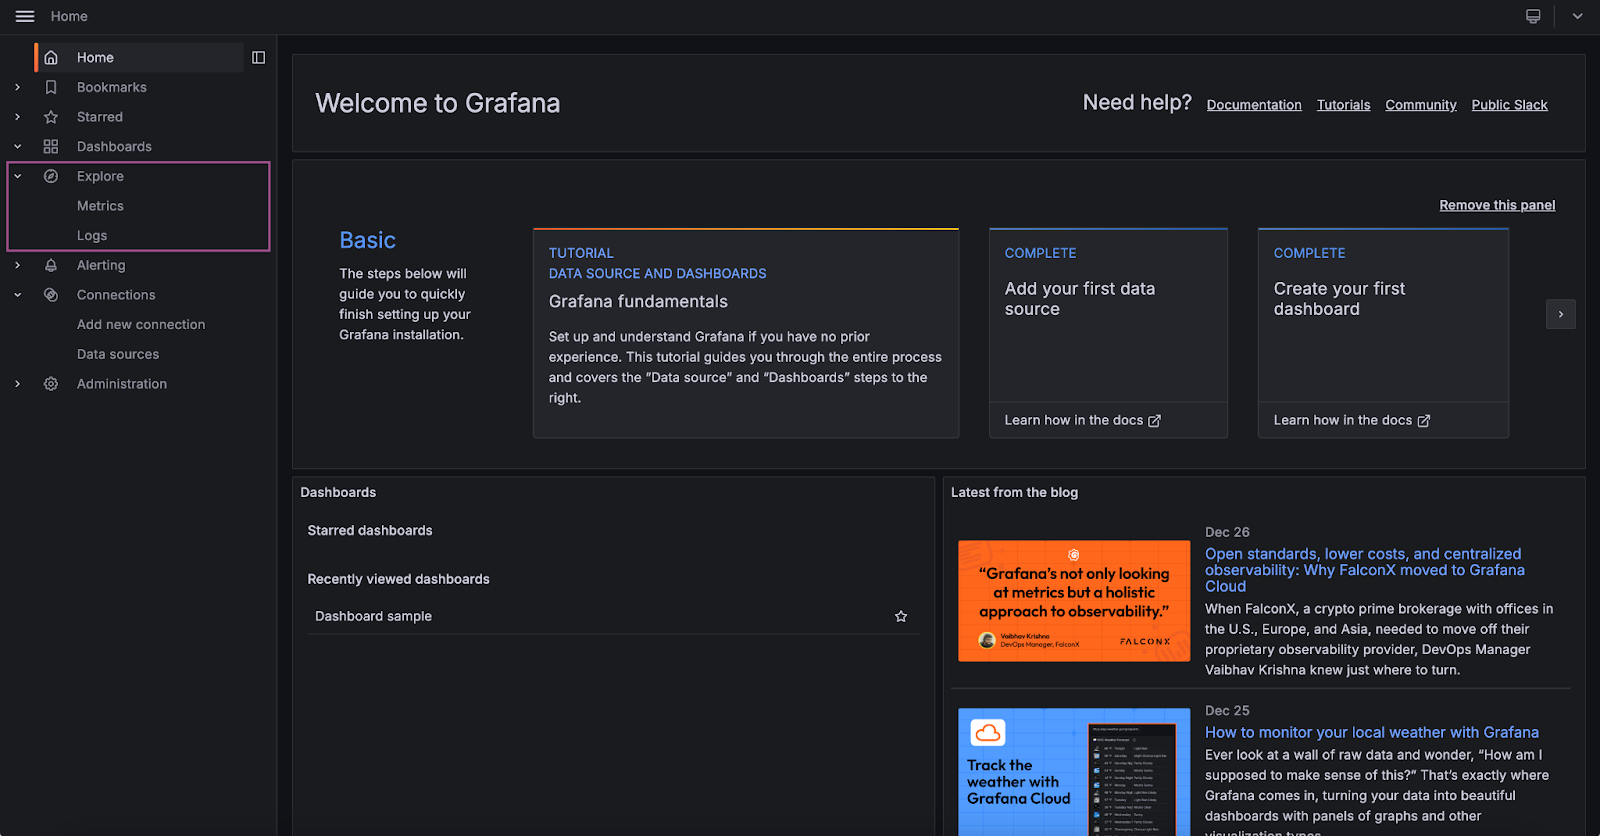
)After we’ve configured and started our Atoti session, we can verify that Atoti is generating OpenTelemetry data by navigating to localhost:3000. In the left-hand pane, we can visit the Explore menu to access our metrics, logs, and traces using Grafana.
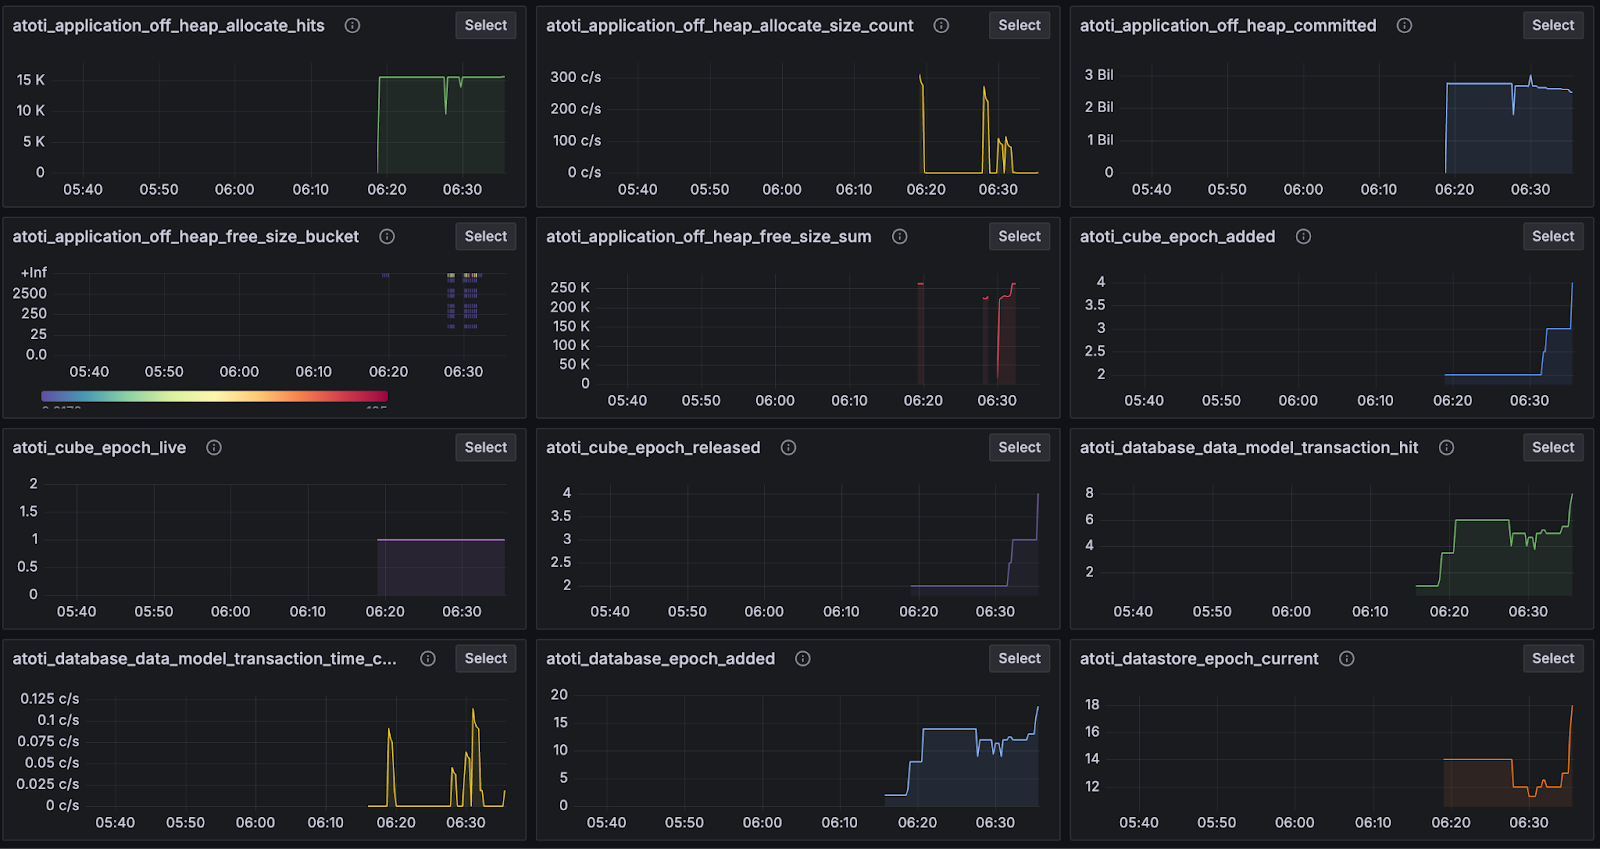
Metrics
Metrics are quantifiable measurements that reflect the health and performance of an application and its infrastructure.
In our setup, Prometheus scrapes the telemetry data exported from Atoti to the OTEL collector and enables us to visualize the Atoti-specific metrics in Grafana.
💡 Note: Check out the documentation for more information on Atoti-specific metrics.
For example, we see various metrics pop up relating to the execution of the notebook, such as loading CSV data into the tables and the resulting table memory footprint. By monitoring the details captured from our metrics, we can better assess the results of our operations in real time.
Logs
Logs are the detailed records of events, warnings and errors occurring over time for a software application or system. Loki is a log aggregation system that natively integrates with Grafana to store and query logs for more effective log management.
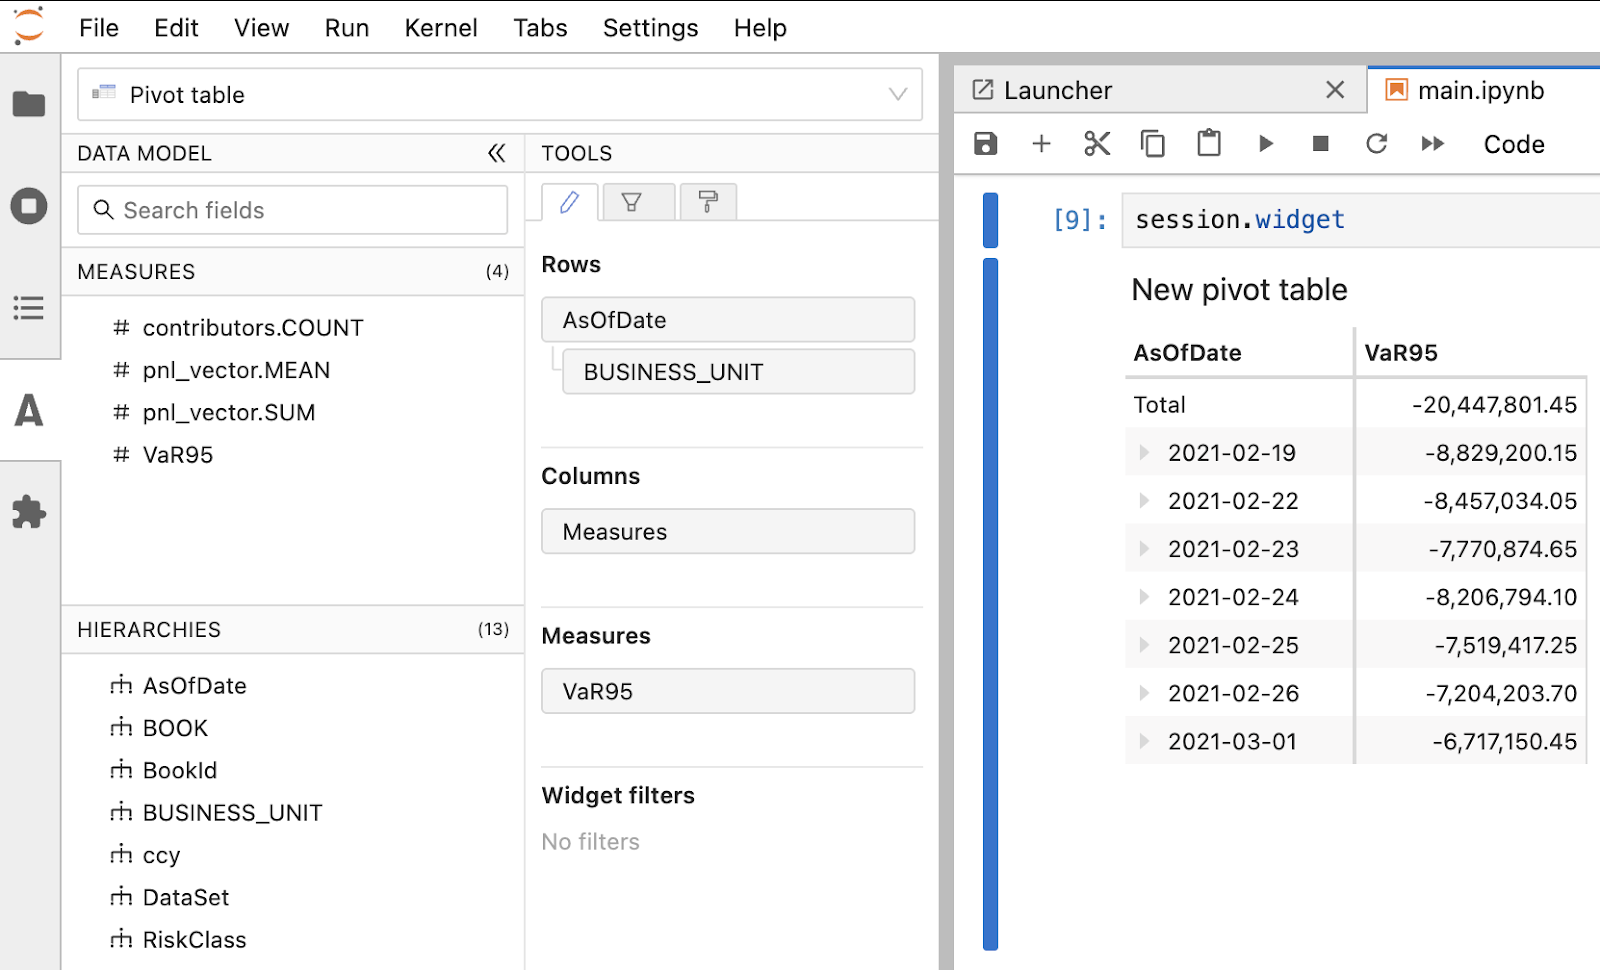
Let’s see how this works in Atoti by running the following query using the atoti-jupyterlab extension widget:
After executing the query from the widget, we see the corresponding Atoti log events generated from the query in Grafana.
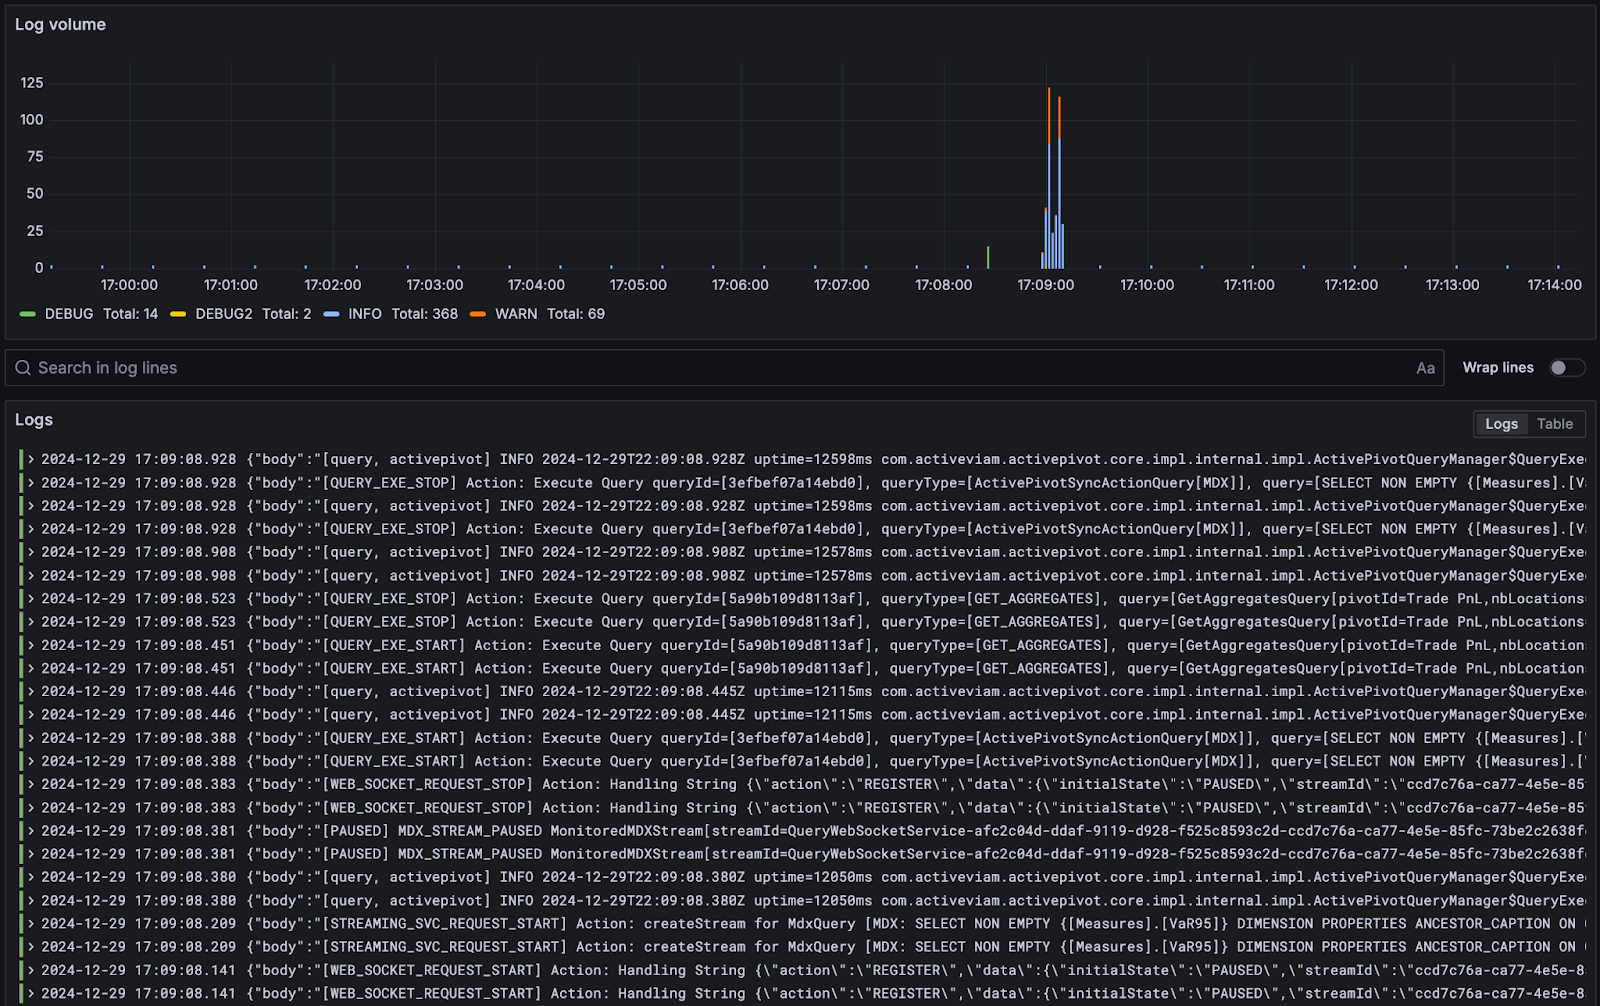
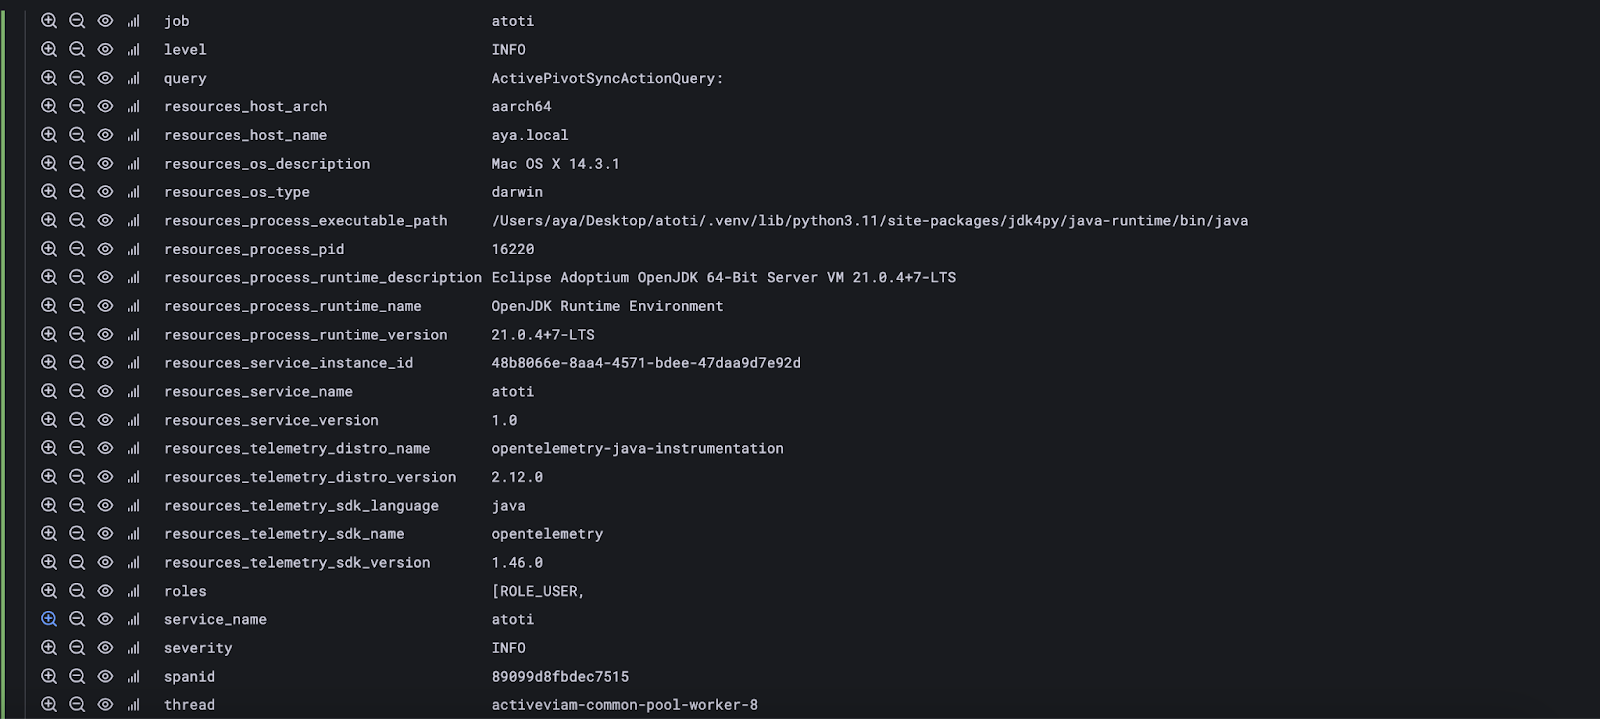
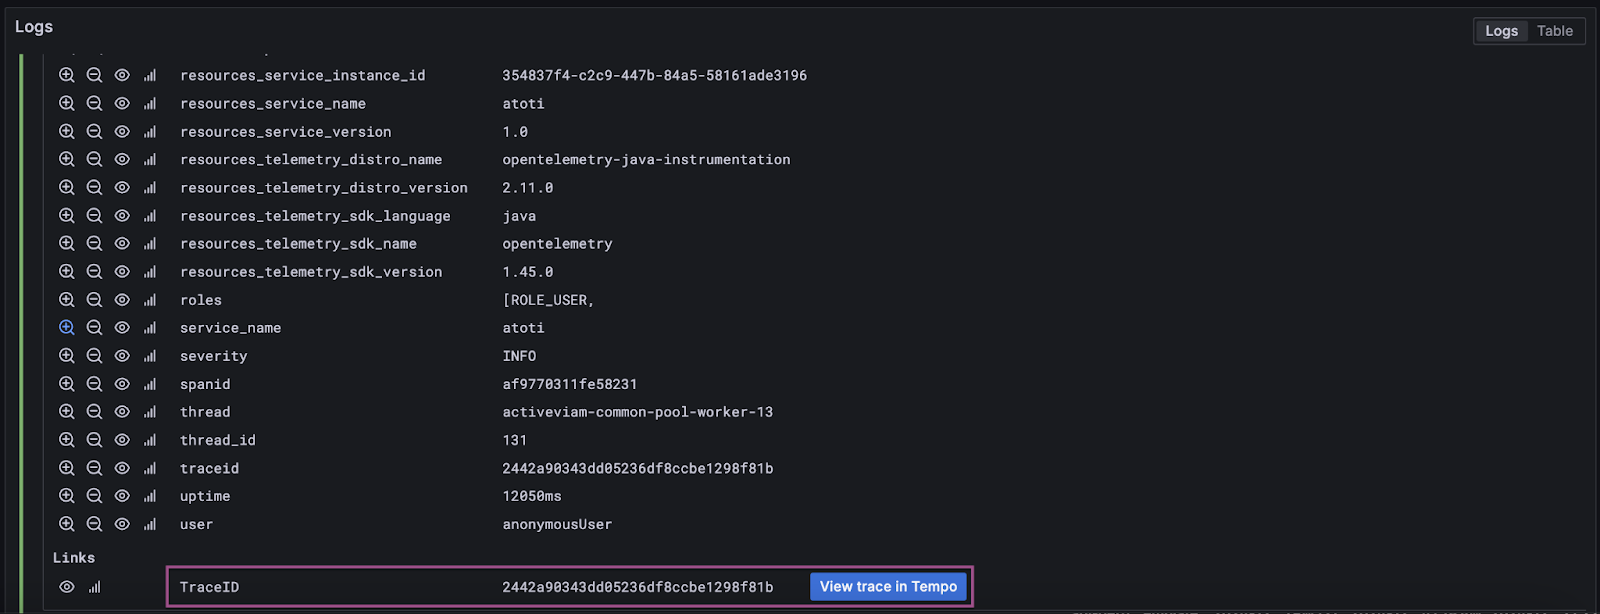
Notice that if we click on a single log record, we can also see the underlying fields of the event along with their values. This also allows us to perform filters based on field values, which enhances the investigative abilities when dealing with logs.
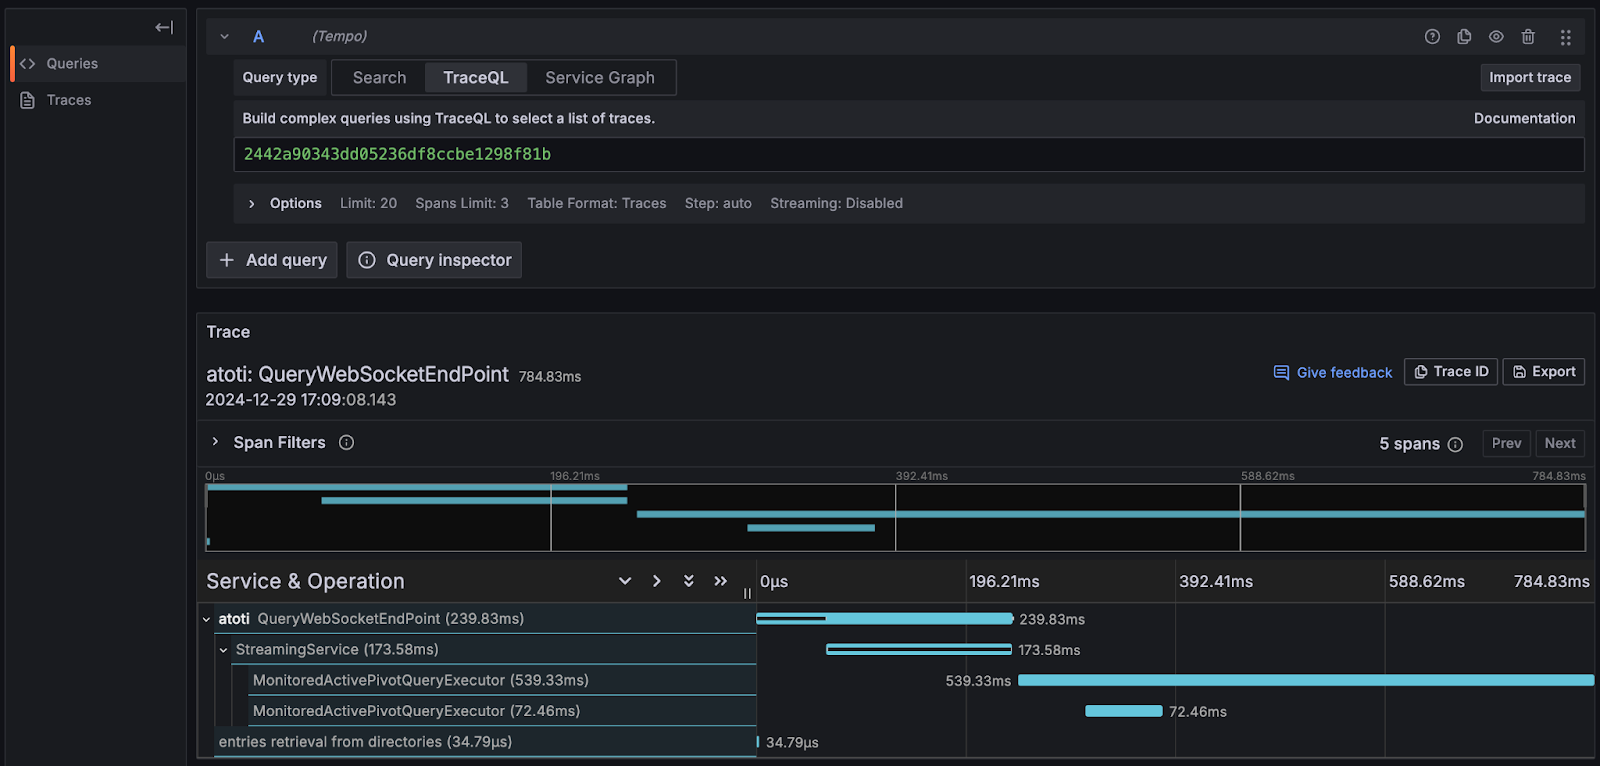
Traces
Traces help us understand the flow of requests and interactions within a system. They are the detailed records of how a request flows through a system, tracking its journey across different components, services, or processes. Traces are made up of one or more spans. A span represents a single operation within that request, providing detailed information about that specific step in the request flow.
With the observability plugin, we can visualize our traces in Grafana using Tempo. Tempo is a distributed tracing backend that natively integrates with Grafana and allows us to visualize the interactions of our requests when we use Atoti.
If we click on one of the log events relating to our query and pinpoint the TraceID, we can then use Tempo to visualize the request flow. Using these insights we are able to determine the time it takes for a request to complete at every stage of its journey across the system. Should any problems arise, this granular view helps us better diagnose issues.
Final thoughts
As applications scale, observability becomes essential to managing increased complexity along with system reliability and optimal performance. This is because at large scale, issues such as performance bottlenecks and out-of-memory instances become more likely.
Atoti with its observability plugin helps to provide better insights into the associated metrics, logs, and traces that represent the behavior and health of its underlying system. Use the Atoti observability plugin to help you monitor your Atoti system performance!