Sometimes, the ‘standard’ average doesn’t take into account the scale or importance between the things being averaged. Enter weighted averages.
Consider the following situations:
- a vendor sets the price for their wares as 10.00USD per unit for 9 or fewer units, 9.50USD per unit for 10-99 units, and 8 USD per unit for 100+ units
- a course rubric states quizzes and homework each count for 10%, each exam 20%, and the final 40% of a student’s final grade.
- a research student needs 10ml of 70% acetone solution, but only has 90% and 60% acetone.
All of the above examples are cases of weighted averages, a common method of taking averages where each contributor has a different “weight” or “importance” to the average.
So, how can we interact with weighted averages in our datasets? Read on, and check out the corresponding notebook in our GitHub notebook gallery.
Set Up
Consider the following example of a manufacturer listing out their cost of production:
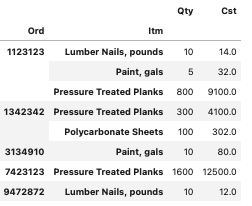
In this example, a few of the items needed to manufacture the company’s wares were purchased multiple times–but each time the unit price was different. This could have happened because the vendor changed their prices, the manufacturer bought a different quantity and thus were eligible for a different price, or perhaps the manufacturer chose a different vendor.
Determining the overall cost of manufacturing is straight forward, but what if the manufacturer wants to dig a bit deeper into the costs, and determine things like what was the average cost of lumber per item manufactured?
Let’s create a quick pivot table to see what measures we have and what they look like.
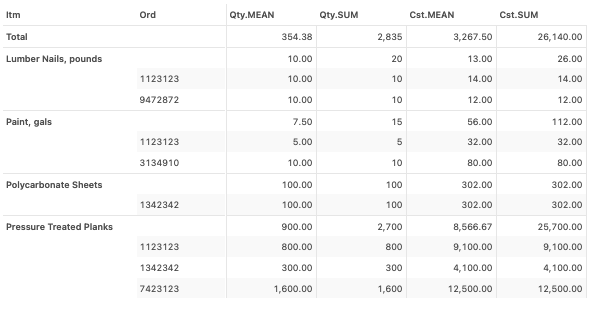
Several things pop out.
Firstly, with the exception of the Cst.SUM Total, none of the grand totals are sensible. After all, paint would sold in terms of volume, bulk lumber nails in terms of weight, and planks and sheets in terms of linear length or square area. Summing or averaging things with different units is odd.
Secondly, the Cst.MEAN is only relevant if we think about it in terms of number of orders-but it does not take into account the variation of quantity in each order.
Weighted Averages
To rectify this, we can create additional measures and replace our existing measures with new ones to better study our costs.
For example, we can calculate the unit price for each item in each order.
m["UnitPrice"] = tt.value(supplycost["Cst"]) / tt.value(supplycost["Qty"])Looking at this in our pivot table, this seems sensible. It would not make sense to sum up the unit cost for the same item across two orders. At best, it might make sense to compute the average at the subtotal.
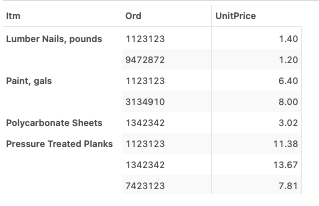
While summing up the unit price may not make sense, it could make sense to determine the max or min price. Let’s create these measures, as well as a (non-weighted) average.
m["UnitPrice.MAX"] = tt.agg.max(m["UnitPrice"], scope=tt.scope.origin(l["Itm"])) m["UnitPrice.MIN"] = tt.agg.min(m["UnitPrice"], scope=tt.scope.origin(l["Itm"])) m["UnitPrice.MEAN"] = tt.agg.mean(m["UnitPrice"], scope=tt.scope.origin(l["Itm"]))
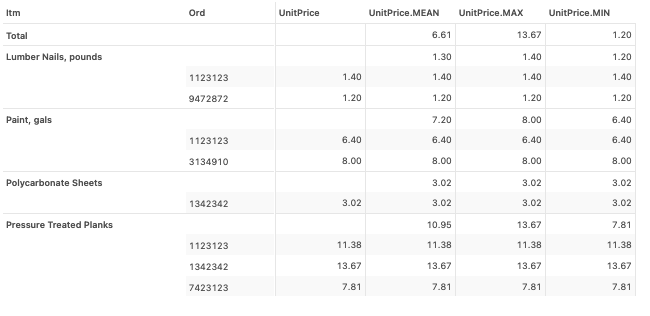
We’ve computed the average unit price, but what about the weighted average unit price – that is, the price taking into account the different order sizes? The average unit price is a simple average.
To compute the weighted average, we need to take the total cost for each item across orders, and divide by the overall number of units purchased for each item across orders. This will help account, or weight, orders where a greater number or more were purchased heavier than orders of the same item where fewer or less were purchased.
m["UnitPrice.WA"] = tt.agg.sum(
    (m["Cst.SUM"] / m["Qty.SUM"]), scope=tt.scope.origin(l["Itm"])
)
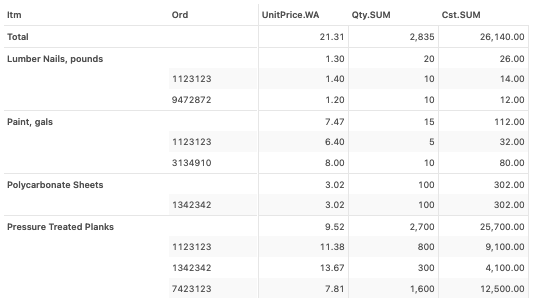
And for comparison, this is not the same as the mean Unit Price!
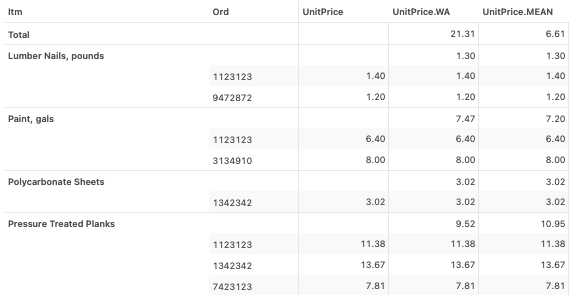
A note about the newly creating measures: it is still accurate regardless of the order of our hierarchies, allowing us to view the supply costs costs from multiple perspectives. For example, if we wanted to determine the unit price weighted average for each item in an order (if that made sense; in this example, it is a bit odd), we can do so with the measure we already created.


