

This article shall be covering methodologies to do a quality check on the predictions from a machine learning model before you deploy it into production.
It happens quite often that the Data Science team has spent, weeks even months to understand the data, perform state of the art Feature Engineering try the various machine learning and deep learning modeling techniques, performed tuning the hyperparameters, and then built the ULTIMATE model to make predictions.
And when this machine learning model is put into production, the business results are below par than the ones in the development conditions.
We shall be using the subpopulation analysis technique on the model predictions and understand why it is important to see through these subpopulations and how to do such an analysis.
Why is subpopulation analysis important:
- To see the business impact of the model predictions: It can be used to check if the model predicts well the various subclasses of the data. This becomes critically important for the subpopulation which contributes the most from the business perspective.
- To check if the model was trained on an unrepresentative dataset: It may sometimes happen that the dataset is used for training the ML model could be unrepresentative for a particular (minority subpopulation) of the actual dataset.
As these subpopulations do not affect the model’s overall score, these nuances are likely to slip through the standard machine learning evaluation criteria like calculation F1 Score, Accuracy, etc.
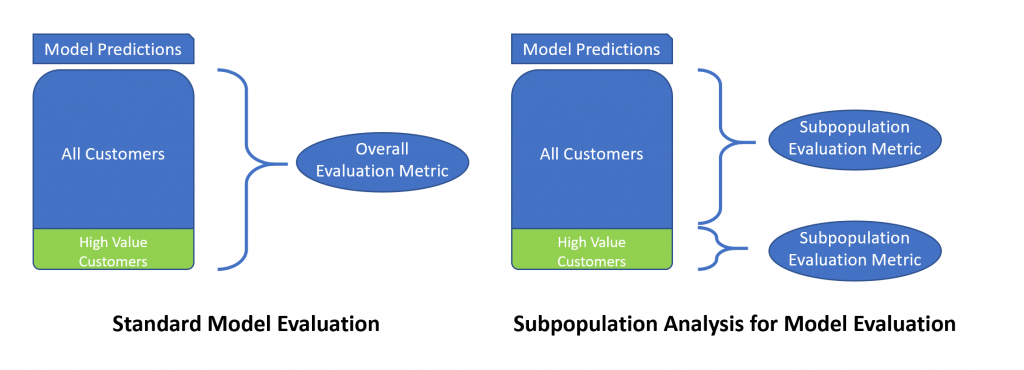
Here is an infographic to summarize the difference in the standard model evaluation techniques and the subpopulation analysis for model evaluation:
How to perform such an analysis:
Though a subpopulation analysis can always be done with pandas by filtering the target subpopulation as a new data frame and then calculating the metric in consideration for each of those DataFrames.
Here we shall be leveraging the power of OLAP to slice and dice the model predictions. We shall be using Atoti for the same, the benefit of using Atoti over others is:
- You can slice and dice the data as you want(make flexible data buckets)
- It enables you to create buckets on the fly
- You can calculate various metrics in a few clicks by leveraging the power of the OLAP cubes
Use case:
In this section, we shall consider a use case in the insurance industry and see the importance of analyzing the model prediction on subpopulations.
The dataset:
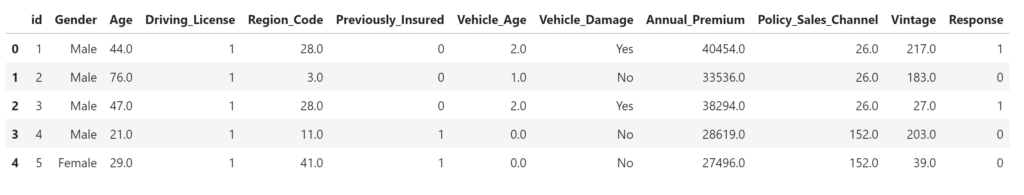
We have the customer list with their demographic details. The objective is to make predictions if the existing health insurance policyholders would be interested in vehicle insurance provided by the company.
We can make the assumption that the people buying the most expensive health insurance are likely to be owning high-end cars and they would be equally valuable as a vehicle insurance customer.
But this information about the premium might be seen as ‘insignificant’ from the machine learning perspective, as the feature may have little or no impact on the model predictions.
Hence, there is a chance that the predictions made by the model on the subcategory of people paying a high premium may see a significant drop without us noticing any drastic change in the overall performance of the model.
Methodology
As discussed, the problem with calculating the performance metrics on the whole dataset is that we miss the details about how the model is performing on the subpopulations (even the ones having a high business impact).
We load the predictions on data from the model and create a datastore from it, and then from datastore, we create a datacube.
import Atoti as tt

# creating a session - it spins up an in-memory database - similar to Apache Spark - ready to slice’n’dice your big data set.

from Atoti.config import create_config
config = create_config(metadata_db="./metadata.db")
session = tt.create_session(config=config)

# Defining a customer data store

customer_store = session.read_pandas(
    data_set,
    store_name="customer_store",
    types={"Policy_Sales_Channel": tt.type.STRING, "Region_Code": tt.type.STRING},
    keys=["id"])

# creating a data cube from this data store

cube = session.create_cube(customer_store, "model_cube")
Calculate the F1 Score and AUC scores by defining custom functions in Atoti for both.
# defining the various measures in Atoti

m["true positive"] = tt.agg.sum(
    tt.where(((l["predicted_response"] == 1) & (l["Response"] == 1)), 1, 0),
    scope=tt.scope.origin(l["id"]),
)

m["true negative"] = tt.agg.sum(
    tt.where(((l["predicted_response"] == 0) & (l["Response"] == 0)), 1, 0),
    scope=tt.scope.origin(l["id"]),
)

m["false positive"] = tt.agg.sum(
    tt.where(((l["predicted_response"] == 1) & (l["Response"] == 0)), 1, 0),
    scope=tt.scope.origin(l["id"]),
)


m["false negative"] = tt.agg.sum(
    tt.where(((l["predicted_response"] == 0) & (l["Response"] == 1)), 1, 0),
    scope=tt.scope.origin(l["id"]),
)

# Now creating the measures

m["recall"] = m["true positive"] / (m["true positive"] + m["false negative"])
m["precision"] = m["true positive"] / (m["true positive"] + m["false positive"])
m["accuracy score"] = (m["true positive"] + m["true negative"]) / m["contributors.COUNT"])
m["false positive rate"] = m["false positive"] / (m["true negative"] + m["false positive"])

# Defining the F1 and AUC scores

m["f1 score"] = 2 * ((m["recall"] * m["precision"]) / (m["recall"] + m["precision"]))
m["AUC"] = 0.5 - (m["false positive rate"] / 2) + (m["recall"] / 2)
The benefit of defining the F1 and AUC in Atoti is that we can perform slice and dice on the cube and do the calculations for the subpopulation as we have created a measure for these scores.
Here the subpopulation of interest is customers paying the maximum premium. So, we take the top 5% of the policyholders by the annual premium paid, and we mess up the predictions for this subpopulation by simply reversing the predictions.
The objective is to imitate a situation where the ML model has been able to learn the characteristics of this subpopulation due to:
- Data drift — The characteristic of the key customers has changed over time
- Unrepresentative dataset — The model is trained on a non-representative dataset as found in the production
Once we have imitates the situation when the target subpopulation has a bad result, but the majority has almost similar populations. We load this dataset into Atoti and calculate the predictions on the various subpopulations based on the annual premium paid.
Results:
We create buckets for customers in various sections based on the premium paid.
# annual premium buckets

premium_store = session.read_pandas(
    pd.DataFrame(
        data=[("0 - 10030", i) for i in range(10030)]
        + [("10030 - 31560", i) for i in range(2630, 31560)]
        + [("31560 - 55098", i) for i in range(31560, 55098)]
        + [("55098+", i) for i in range(55098, 448156)],
        columns=["Annual_Premium group", "Annual_Premium"],
    ),
    keys=["Annual_Premium"],
    store_name="Premium Groups",
)

customer_store.join(premium_store)
Thanks to Atoti, we can actually create new buckets on the fly for various variables and change modify them without actually having to rerun the whole pipeline again.
Once we have created the added the new buckets, inspecting the F1 and AUC score on the buckets is as easy as:
session.visualize("Slicing Data on Age")
We could see that once we messed up the predictions, there is just a drop of 0.03 in the overall AUC score and a drop of 0.02 in the overall F1 score. But for the target subpopulation, as expected, the AUC score drop from 0.79 to 0.23, and the F1 score drops from 0.43 to 0.03.
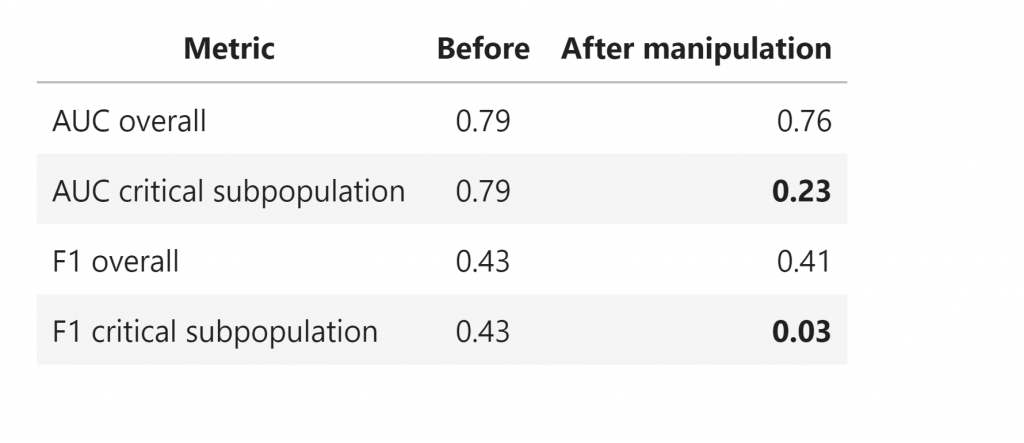
If we were to just monitor the model’s overall performance, we would have definitely missed such a significant drop in the key customer segment.
So it would be highly beneficial to monitor the various subpopulations to make sure that the model is not predicting an important segment of customers incorrectly or it is not discriminating against a particular section of customers based on Gender, Age group, Ethnicity, etc.
Further analysis
We may want to define the critical segments, or there could be other subpopulations that need to be inspected for business or compliance reasons.
We can use Atoti to do the subpopulation analysis on the fly, making the whole process much faster and smoother than manually slicing the data to see the metrics for the subpopulations.
Here is an example of how to create similar subpopulation slicing based on age.
# age group buckets
age_groups_store = session.read_pandas(
    pd.DataFrame(
        data=[("0-30Y", i) for i in range(30)]
        + [("30Y - 40Y", i) for i in range(30, 40)]
        + [("40Y - 50Y", i) for i in range(40, 50)]
        + [("50Y+", i) for i in range(50, 200)],
        columns=["age group", "age"],
    ),
    keys=["age"],
    store_name="Age Groups",
)

customer_store.join(age_groups_store)
Now we can calculate the evaluation metrics on each of these subpopulations. Compare this with the effort we need to do such an exercise in pandas and calculating the F1 scores!!
Conclusion
Before deciding to move a machine learning model into production, make sure to perform a check of the model performance metrics on the subpopulations of interest.
And Atoti is there to make the subpopulation analysis easy for you.
Check out our GitHub repo for the notebook with the detailed analysis and other such interesting use cases.

