

Atoti is a Python library for performing data aggregation and creating data-viz widgets such as pivot tables and charts in a Jupyter notebook. It comes with a business intelligence web application, enabling fuss-free dashboard creation and sharing.
Note: This article has been tested against Atoti 0.5.2.
Installation
Atoti can be installed with pip/Poetry or conda. Let’s keep it simple with pip:
pip install atoti[jupyterlab]
It is optional to install graphviz, however, it is recommended for this article as we will be displaying the schema of the cube.
Once this is done, you can start JupyterLab:
jupyter lab
Building and exploring a data model
For this guide, we’ll work on this popular Kaggle data set of trending YouTube video statistics. The goal will be to define some key metrics and create practical visualizations.
We start with some data prep with Pandas:
import pandas as pd

videos_df = pd.read_csv(
    "USvideos.csv",
    usecols=[
        "category_id",
        "channel_title",
        "title",
        "trending_date",
        "video_id",
        "views",
    ],
)

# Parse trending date and split it into year/month/day columns.
trending_date = pd.to_datetime(
    videos_df["trending_date"],
    format="%y.%d.%m"
)
videos_df["trending_date"] = trending_date.dt.date
videos_df["trending_year"] = trending_date.dt.year
videos_df["trending_month"] = trending_date.dt.month
videos_df["trending_day"] = trending_date.dt.day

videos_df.sample(5)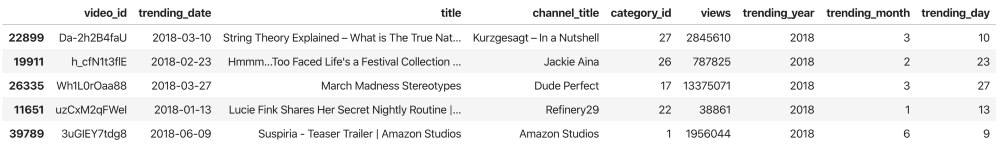
import json
from pathlib import Path

# Parse JSON file holding mapping between a category ID and its title, and make a DataFrame out of it.
category_data = json.loads(Path("US_category_id.json").read_text())
data = [
    [int(item["id"]), item["snippet"]["title"]]
    for item in category_data["items"]
]
categories_df = pd.DataFrame(data, columns=["id", "category_title"])

categories_df.head()

Now that the DataFrames are prepped, we can create the Atoti analytical cube:
import Atoti as tt
session = tt.create_session()
videos_store = session.read_pandas(
    videos_df, keys=["video_id", "trending_date"], store_name="videos"
)
categories_store = session.read_pandas(
    categories_df, keys=["id"], store_name="categories"
)

videos_store.join(categories_store, mapping={"category_id": "id"})

cube = session.create_cube(videos_store, "YouTube", mode="manual")
h, l, m = cube.hierarchies, cube.levels, cube.measures
cube
In this case, we choose the manual cube creation mode to shape the cube later. By default, however, the cube structure is inferred from the types of the stores’ columns.
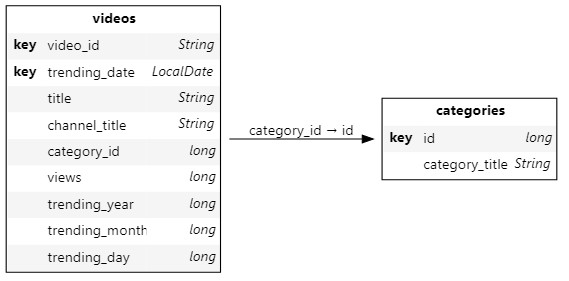
Run cube.schema to visualize the schema of the cube created:
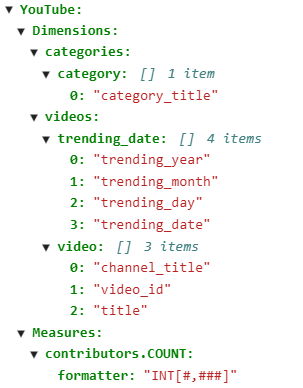
We also create analytical hierarchies — extra available axes in pivot tables or charts:
# A channel has multiple videos and each video can be renamed so it can have multiple titles.
h["video"] = [
    videos_store["channel_title"],
    videos_store["video_id"],
    videos_store["title"]
]

# The trending date can also be organized with multiple levels.
h["trending_date"] = [
    videos_store["trending_year"],
    videos_store["trending_month"],
    videos_store["trending_day"],
    videos_store["trending_date"]
]

# The category hierarchy has a single level: the category title.
h["category"] = [categories_store["category_title"]]
cube
From there, we can create visualizations to get a sense of the data set. The visualize method on Session instances outputs an interactive widget that can be built with mouse & keyboard inputs — no code needed.
We’ve created these widgets without defining any specific metrics but one of the strengths of Atoti is for building a data model with aggregated indicators:
views_max = tt.agg.max(videos_store["views"])
m["views"] = tt.agg.sum(
    views_max, scope=tt.scope.origin(l["video_id"])
)
Adding the views metric tocube.measuresmakes it directly available in the Atoti JupyterLab extension:
Let’s define another metric that will give us the aggregated distinct count of trending videos:
m["trending_videos"] = tt.agg.count_distinct(videos_store["video_id"])
Let’s make one more widget:
Sharing our insights
We can publish all the widgets we’ve built in JupyterLab in the Atoti dashboarding app:
Widgets published in the app can be added to dashboards with additional features such as quick filters and filtering on multi-selection:
The dashboarding application is a “safe” environment: all the queries are read-only so there is no risk of breaking the model or tampering with its data.
You can share a link to your Atoti app to show it to other people.
If you would like to know more, head over to the documentation.

