Expect many changes as part of the latest upgrade in Atoti, including enhanced performance and improved visuals
As part of v0.6.0, we are making great improvements to the Atoti library: better performance, more explicit data handling, and standardization of data storage naming. Read on for more details.
Improved query times and memory usage
Even before getting into any function changes, there are some under the cover changes coming to Atoti, delivering a speedier, smoother experience both on the data modelization side and in dashboard visualization. You’ll find measure and hierarchy creation to be smoother and snappier than in previous versions.
Loading data
In previous iterations of Atoti, one feature we frequently highlighted was Atoti’s ability to first load a sampling of data to streamline your work, allowing you to define your data model and analytics on a smaller data set for performance reasons, then using the load_all_data() feature to load the rest of your data into your cube. And, while v0.5.5 would return a message stating only a sampling of data was loaded and how to load the rest of it, the user was left without control of which data was sampled. This sometimes led to a non-representative sample across stores being loaded, which impacted user experience.
In v0.6.0, we’ve removed the sampling mechanism and this control is placed in the hands of the users. Now, Atoti will load all data provided, and the user is in control if they load all data up front, or just a curated sample. We recommend starting with a representative sample for data modeling purposes, then loading the remaining after modeling is done.
Real-time watch
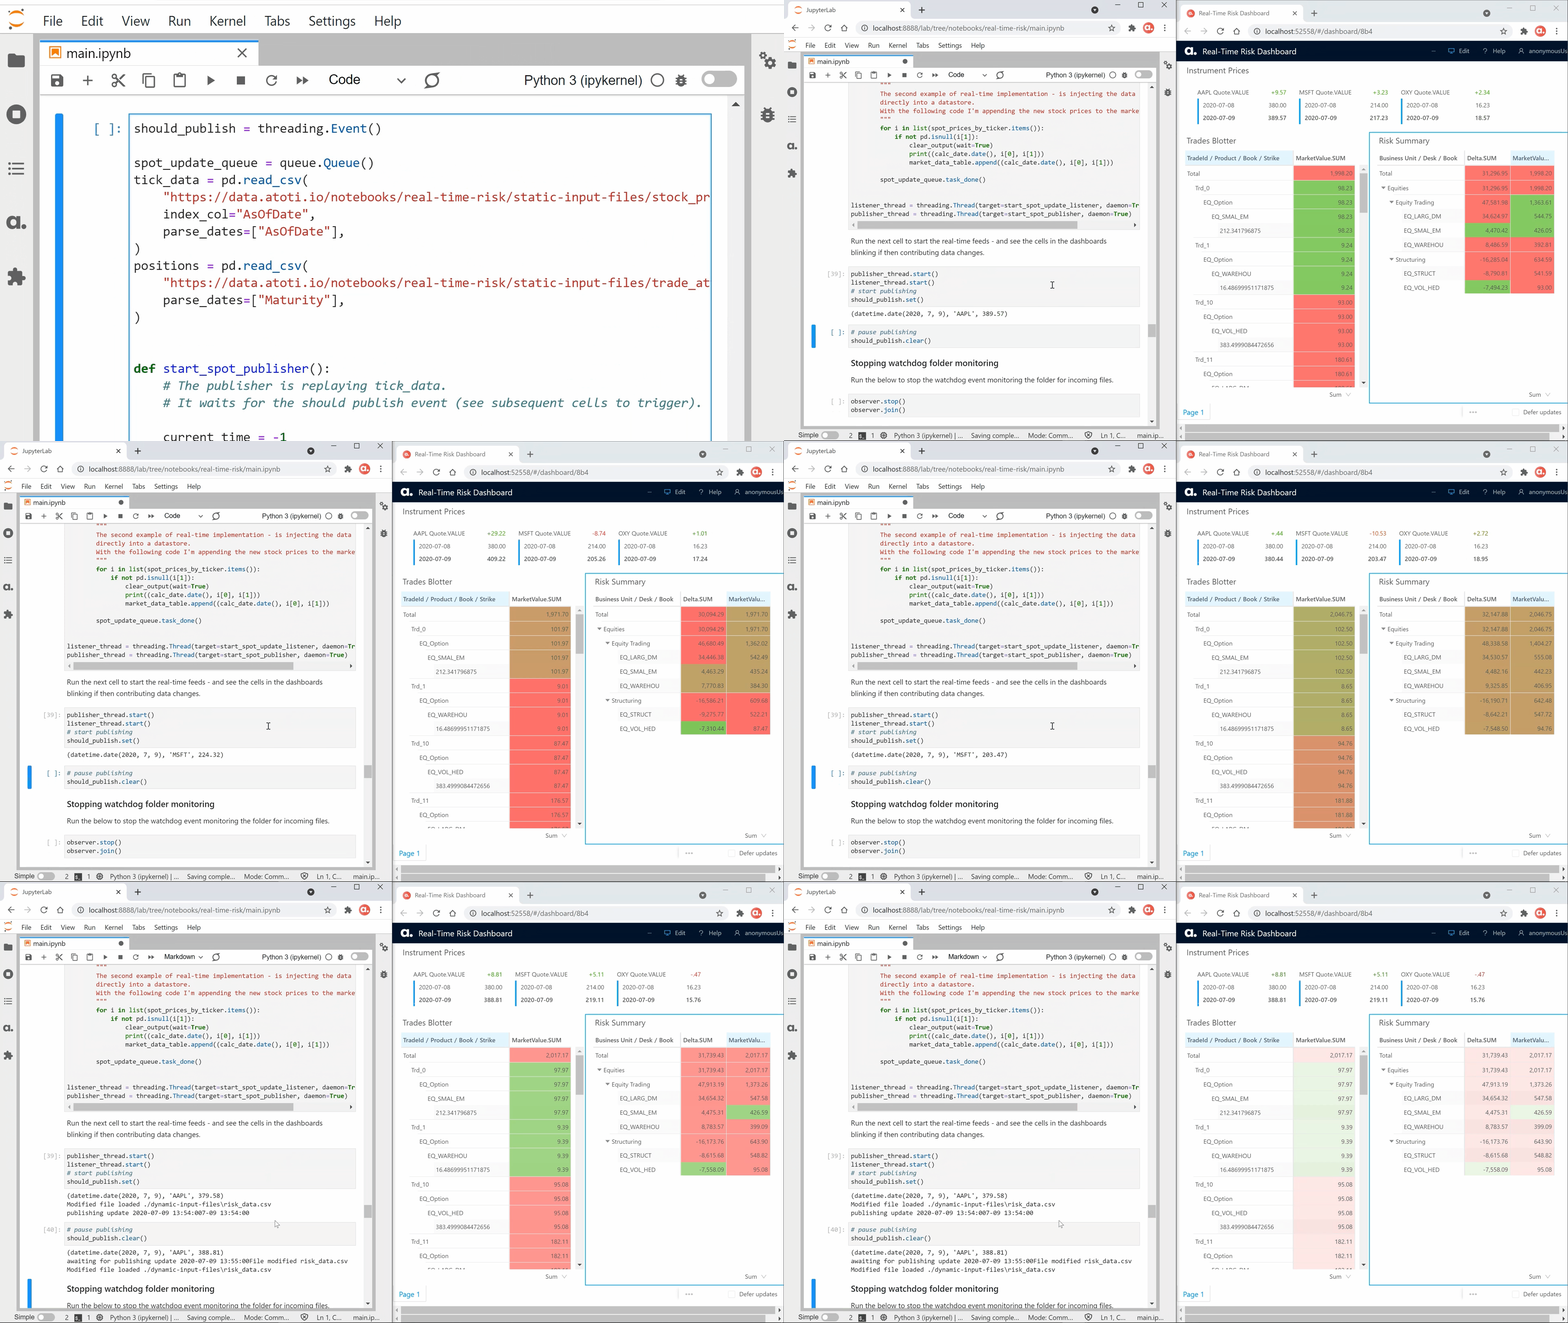
Previous versions of load_*() and read_*() methods in Atoti included a watch parameter. We’re removing this parameter, allowing the user to use a preferred watch plug in. We provide an example using WatchDog in our documentation at docs.atoti.io.
Changing from stores to tables
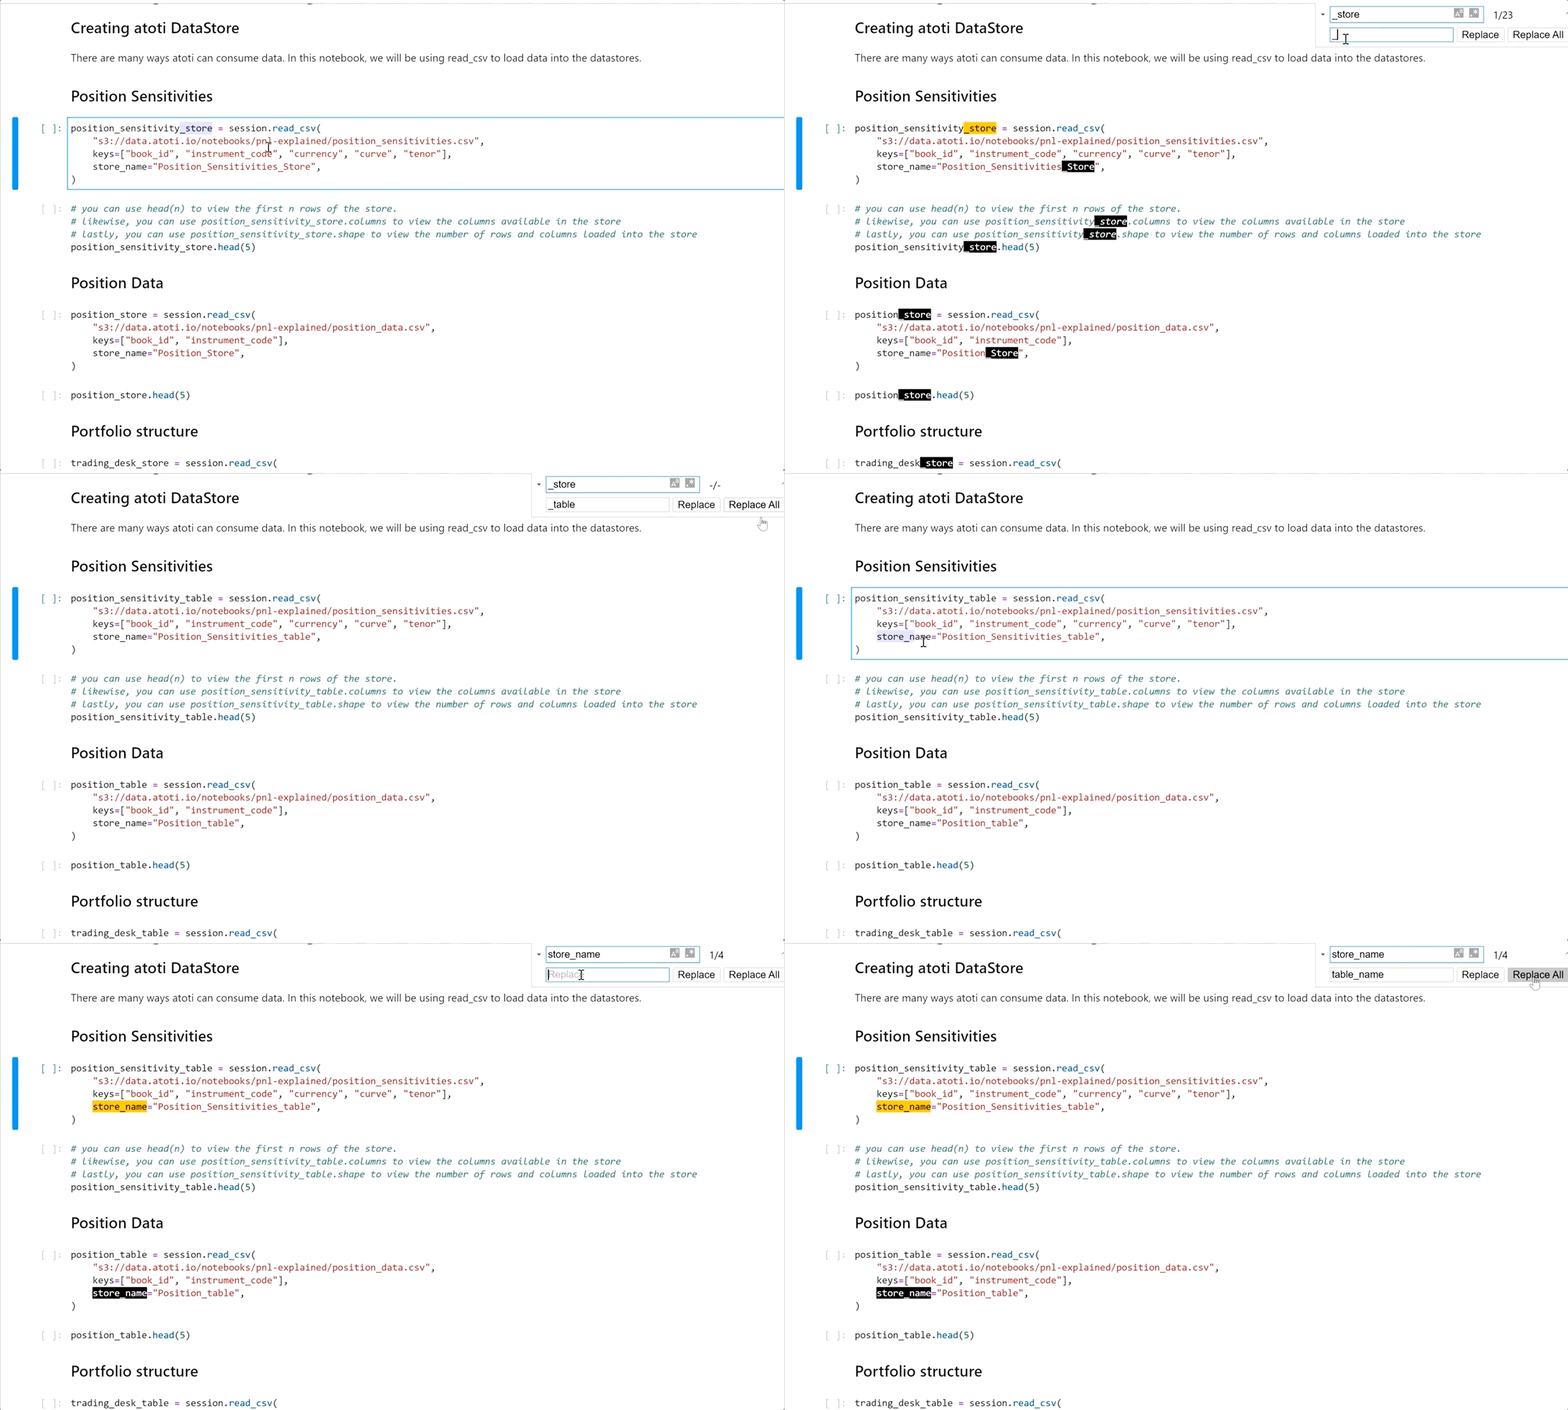
One of the biggest changes we’ve made is changing from the store.Store class to table.Table across the board. We did this to better align with the language used in most database management systems. This change does not impact the functionality of the previous functions and properties.
Faster dashboards and tabular table view
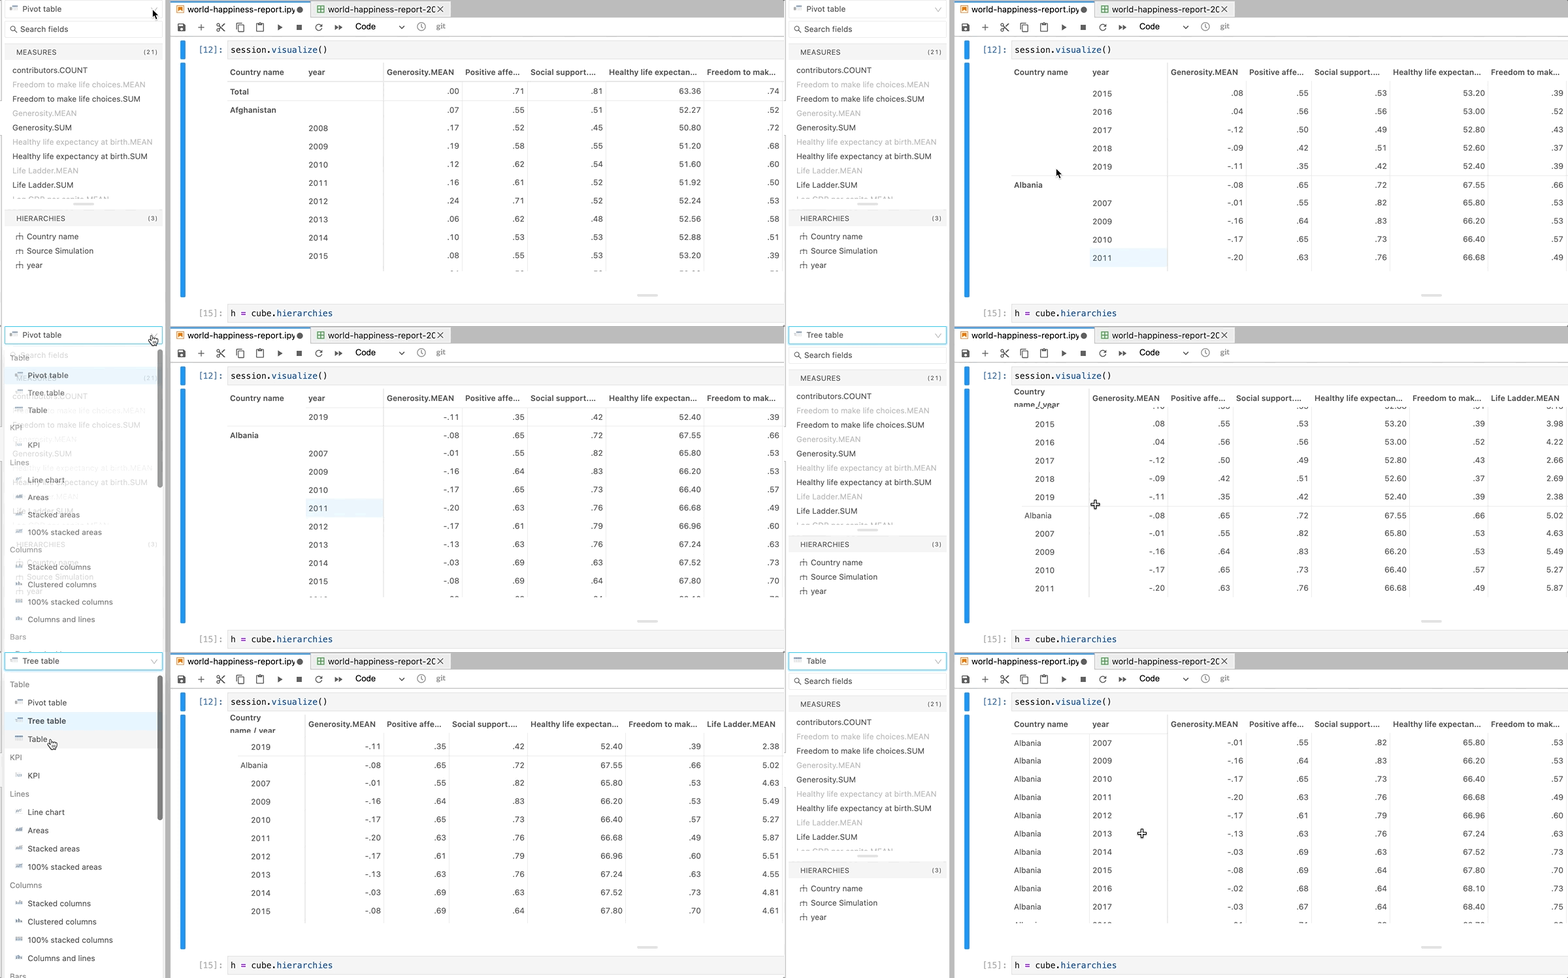
As part of our widgets, we have now added a tabular table view, in addition to our existing pivot table and tree view, allowing the user to visualize their data in a flat manner.
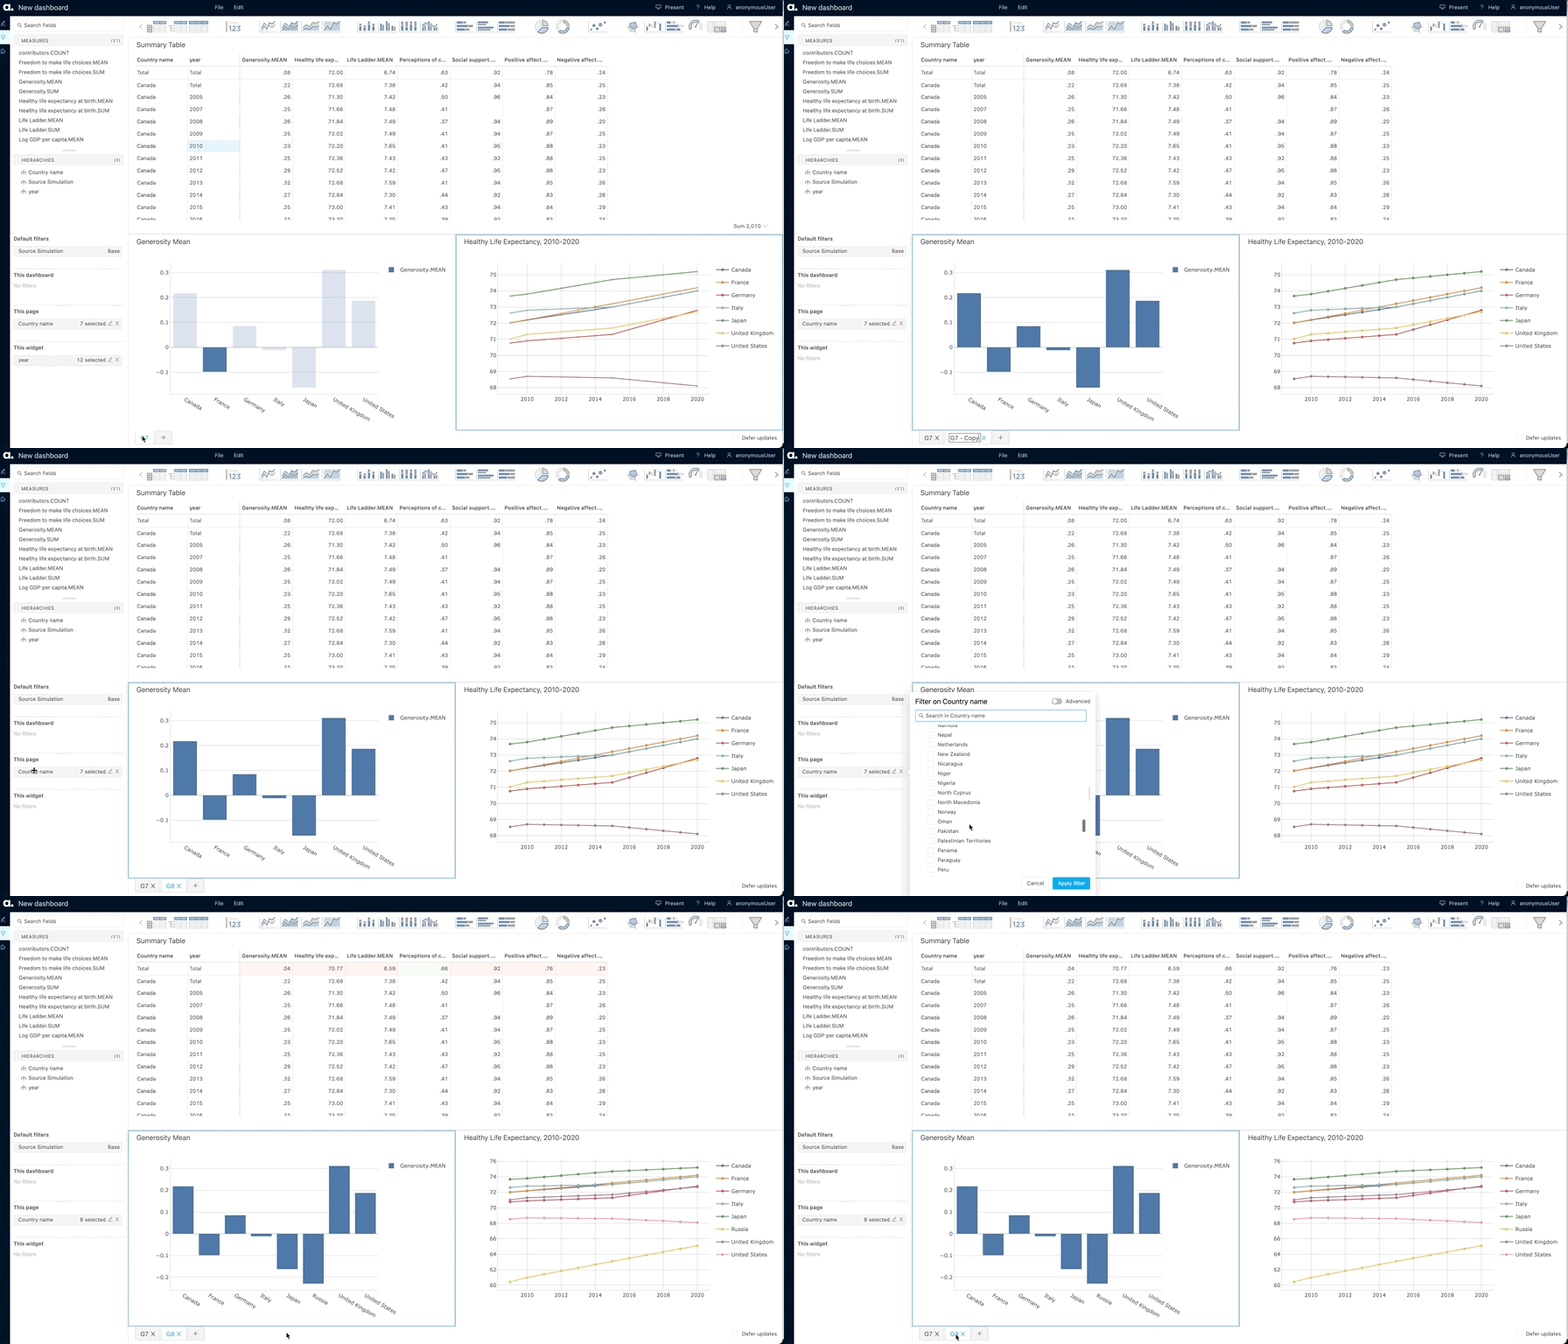
For our dashboards, expect two new features. We have introduced thumbnails on the landing page, letting you see a snapshot of each dashboard for easier selection.

We also enabled the ability to duplicate a dashboard page, allowing you to copy an existing dashboard for speedy customization. For example, duplicate an existing dashboard and adjust the page filters to create a new dashboard.
Enhanced usability
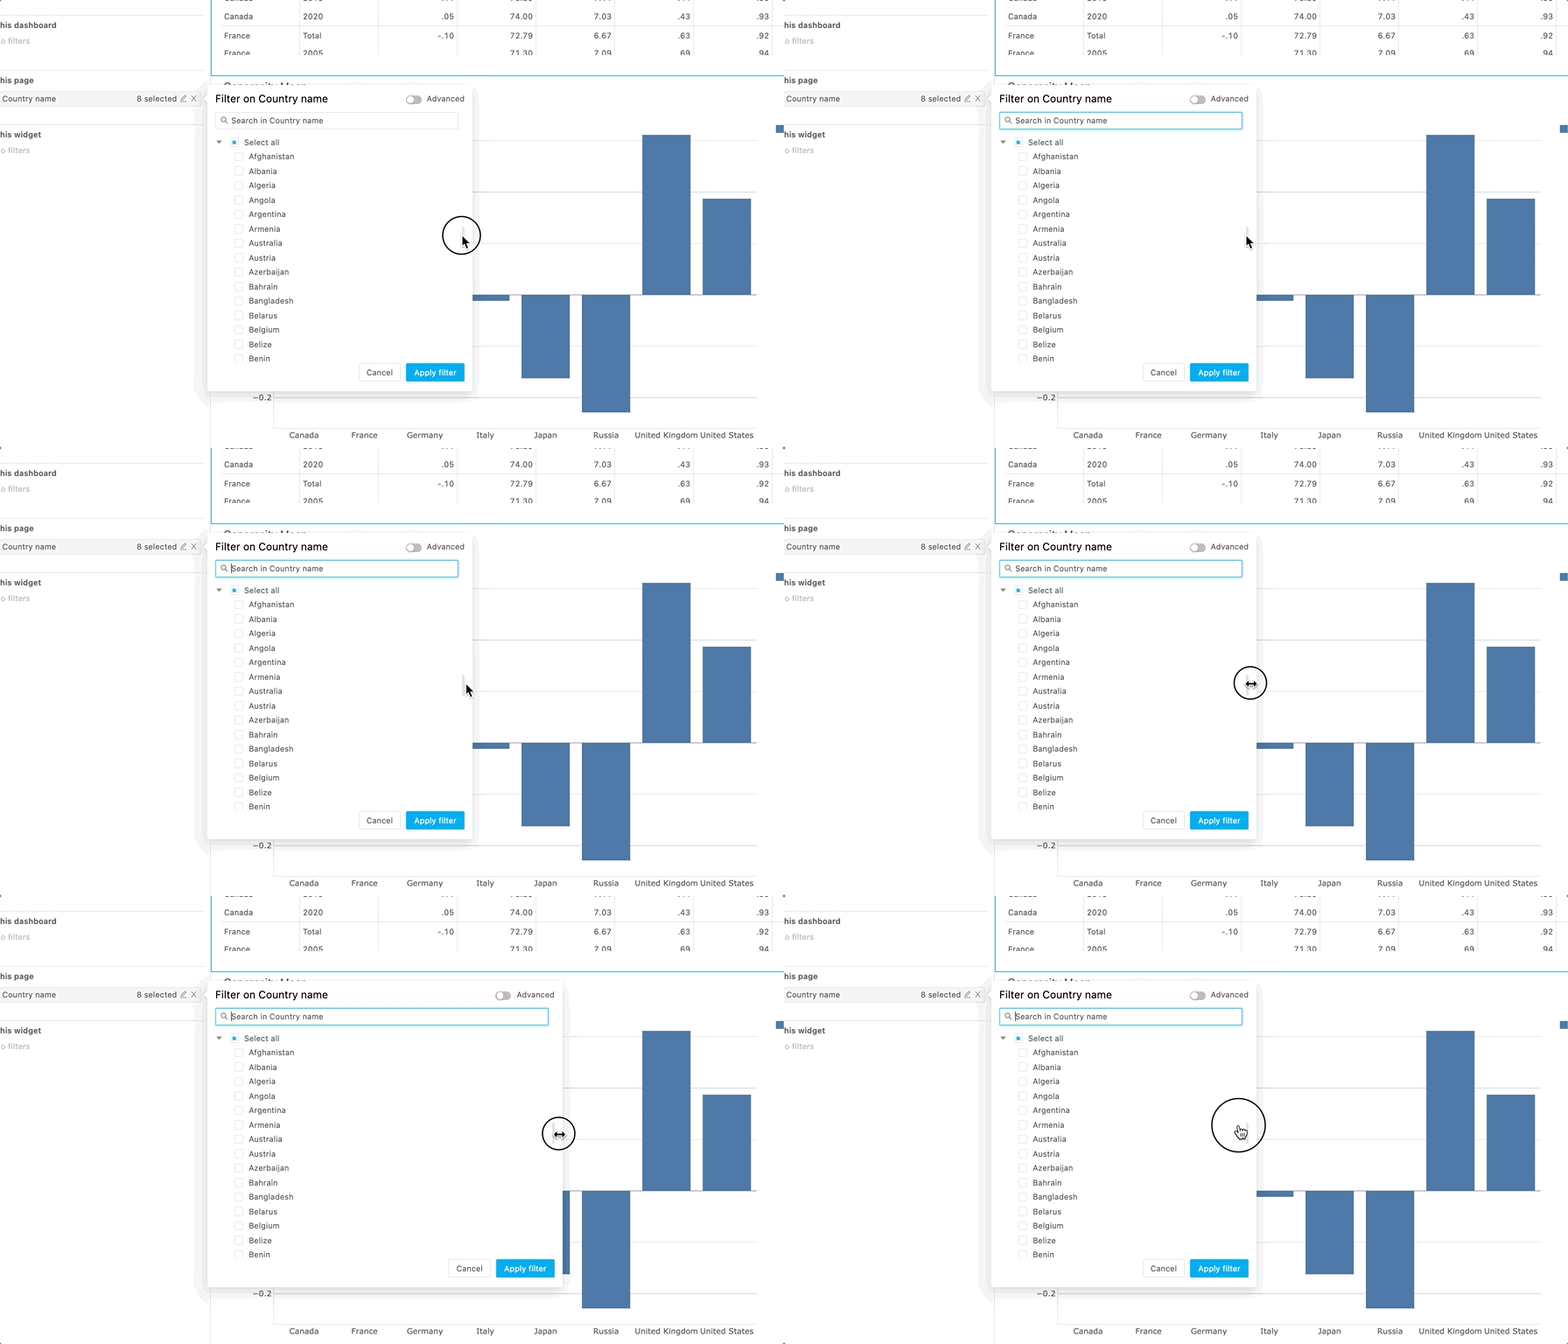
Additionally, we’ve added a few usability features. With v0.6.0, you will be able to horizontally resize the filter pop-over.
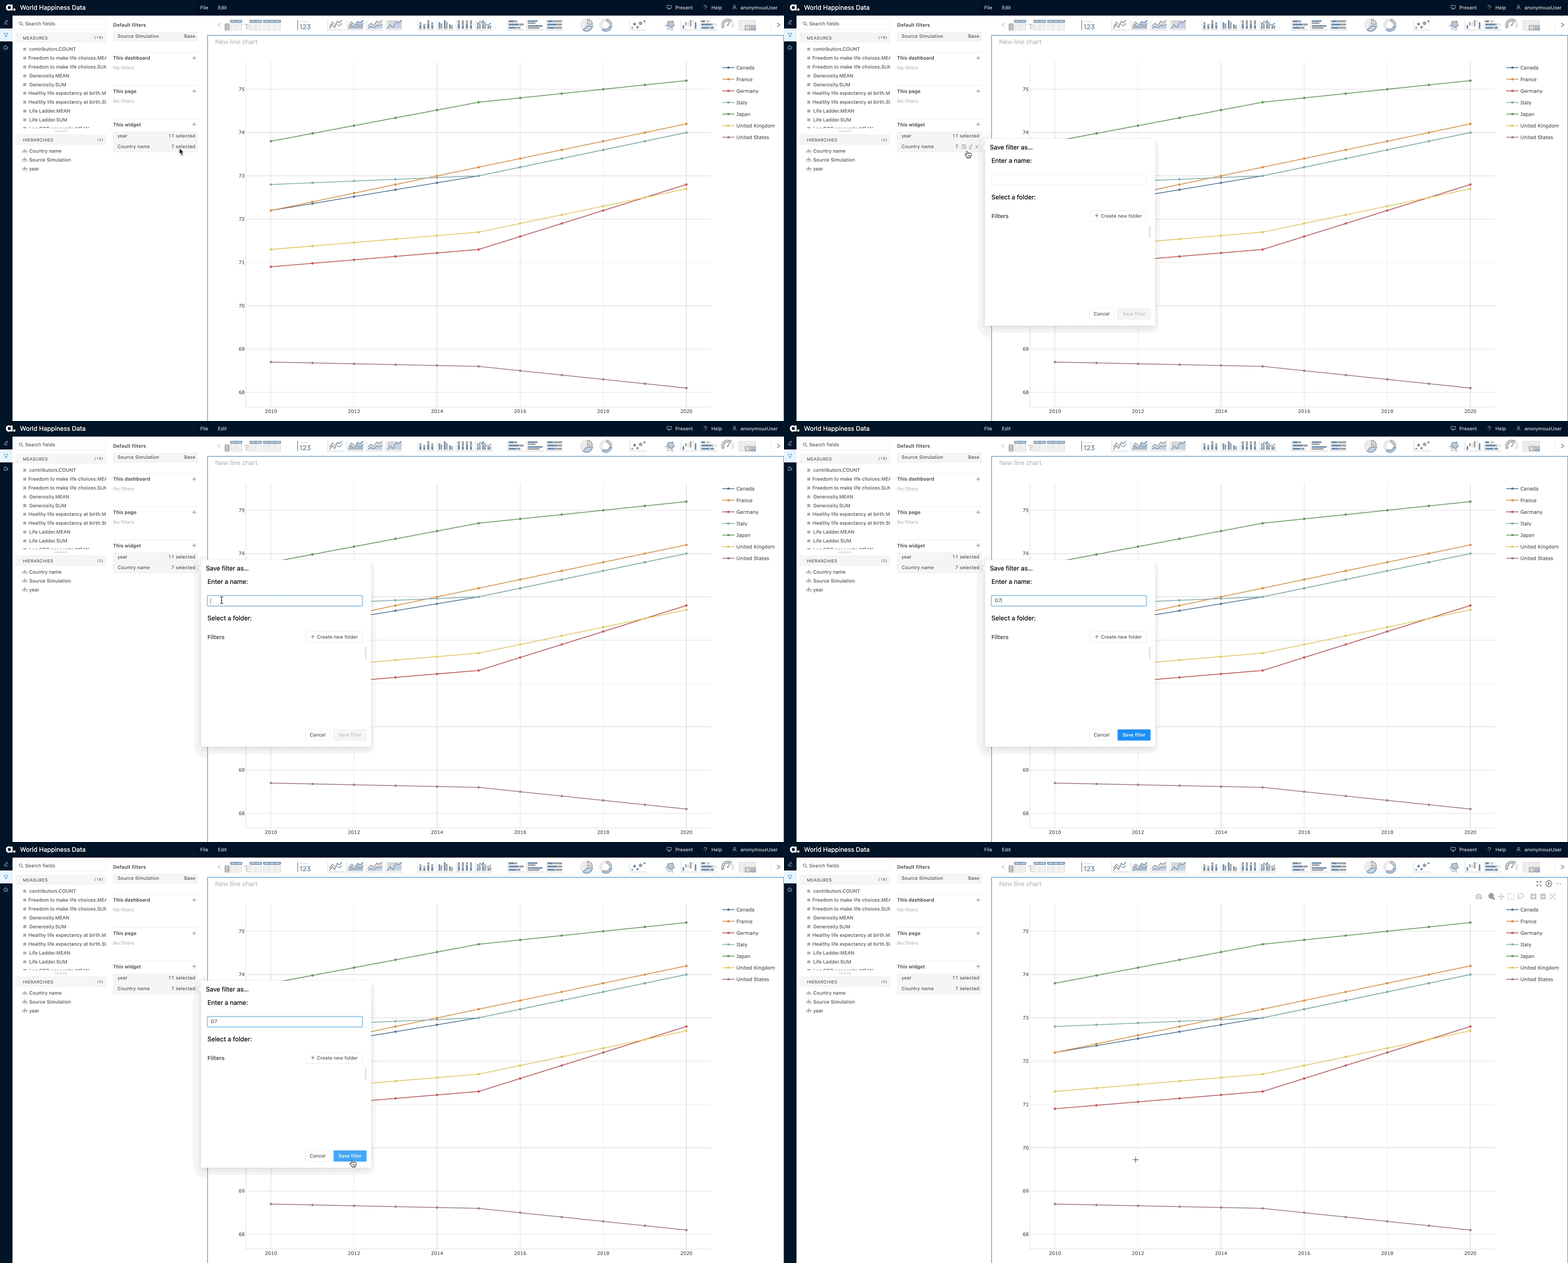
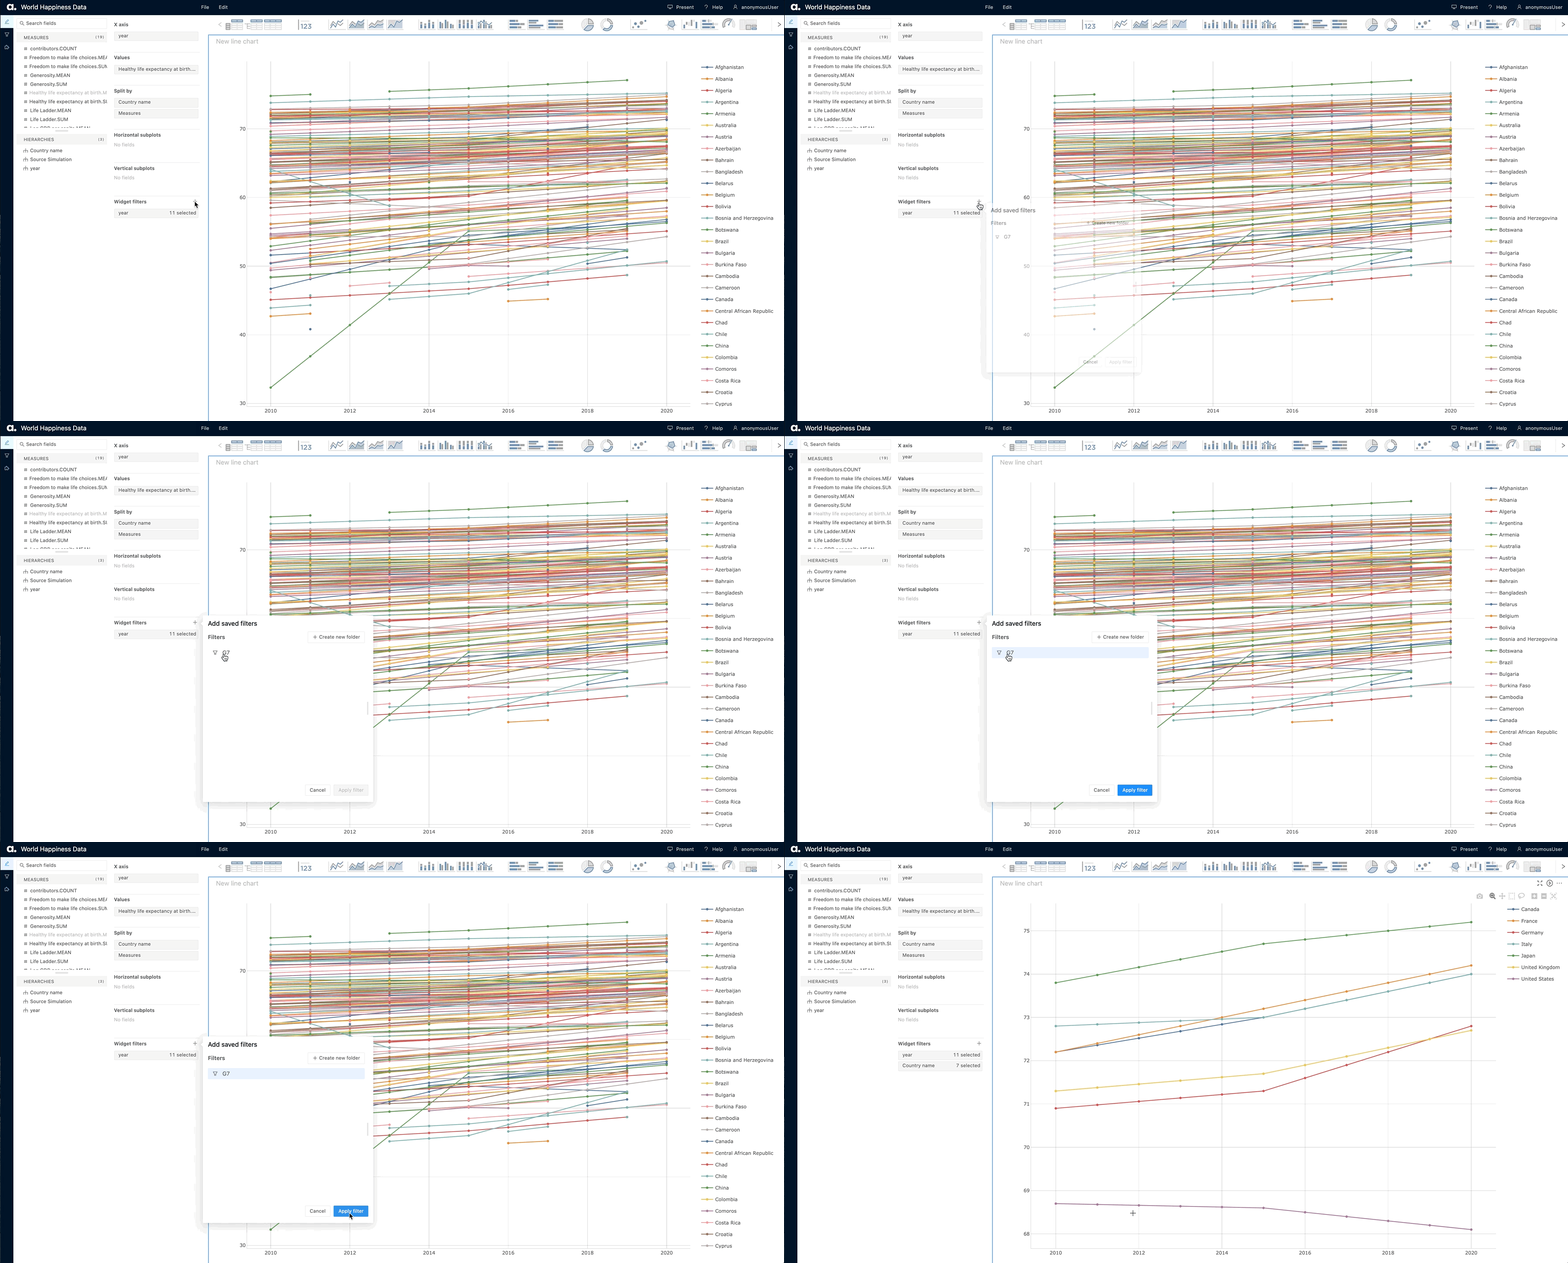
You can also save filters for later use.
We have also added tooltips on buttons in the title bar of widgets, providing greater clarity to each button and increasing the accessibility of the widgetry.

We hope you love these changes. Keep an eye out for further content, including an in-depth article regarding our changes to simulations and a guide for upgrading your notebooks from v0.5.5 to v0.6.0. We’re excited to bring these changes to you!


